this post was submitted on 13 Mar 2024
1085 points (93.9% liked)
Technology
66231 readers
5339 users here now
This is a most excellent place for technology news and articles.
Our Rules
- Follow the lemmy.world rules.
- Only tech related content.
- Be excellent to each other!
- Mod approved content bots can post up to 10 articles per day.
- Threads asking for personal tech support may be deleted.
- Politics threads may be removed.
- No memes allowed as posts, OK to post as comments.
- Only approved bots from the list below, this includes using AI responses and summaries. To ask if your bot can be added please contact a mod.
- Check for duplicates before posting, duplicates may be removed
- Accounts 7 days and younger will have their posts automatically removed.
Approved Bots
founded 2 years ago
MODERATORS
you are viewing a single comment's thread
view the rest of the comments
view the rest of the comments
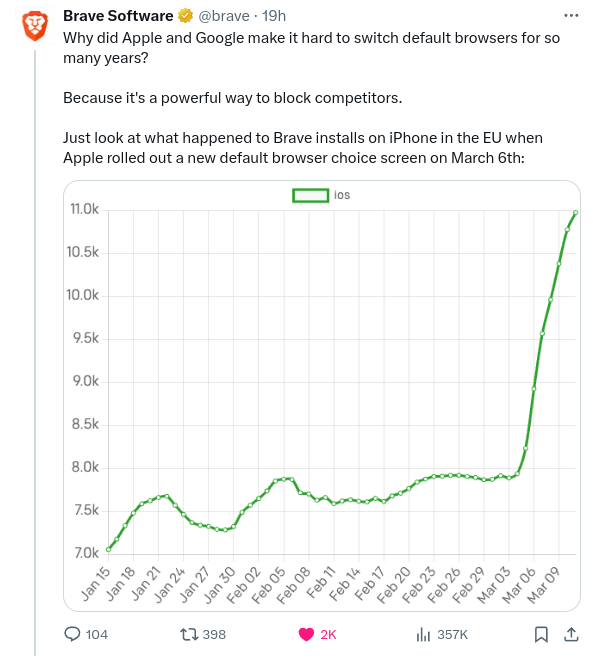
That graph is trash. The baseline needs to be at zero.
No it doesn't.
It's meant to illustrate a change and it does so perfectly fine. It's not a scientific paper.
It's a 32-34% increase looking at the graph. That's significant enough to shout about.
Imagine any change you could make surprising competition by 25% in any market. That's huge.
But you don't get that percentage from looking at the graph. You get that from looking at the numbers.
The graph height increases by 300% in the last ~~3 months~~ 9 days.